Pantacor Hub now has a Live logs tab: open a device and watch its output as it happens, straight in your browser.
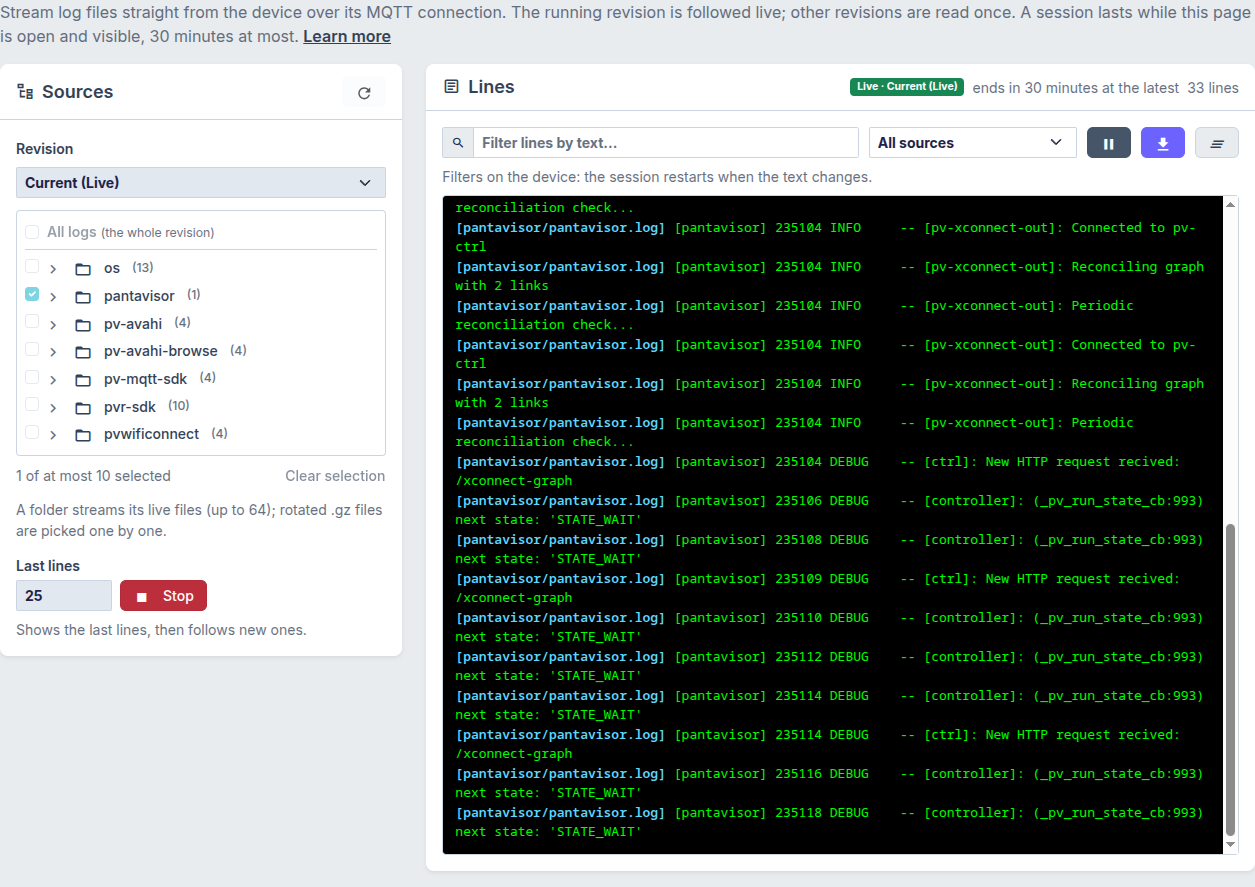
When you’re investigating a failed startup or an intermittent error, you can follow Pantavisor’s own log, a container’s console, or files its applications write under /var/log.
Choose what you need to see
The source picker lists the device’s logs in a tree. Select an individual file, a whole container folder, or All logs for the revision. The current revision follows new output; older revisions and rotated .gz files can be read once.
Filter on the device, stream only what matches
Type a filter such as error or pv-xconnect to focus on the messages you need. When you press Start, the Hub sends that filter to the device. The device agent checks each log line for the text, using a case-insensitive substring match, and sends only matching lines over MQTT to your browser. Non-matching lines stay on the device and don’t consume streaming bandwidth.
The filter applies to both the initial tail and new output: with a filter set, the last-lines setting counts matching lines. If you change the filter while streaming, the session restarts with the new filter applied on the device.
You can also pause the view, narrow it by source, and download the filtered output you’ve received.
Try it
- Sign in to Pantacor Hub and open a device you own.
- Choose Live logs, select your sources and revision, and optionally add a filter.
- Press Start. You’ll get the last 200 lines by default (matching lines if a filter is set), followed by new output from the running revision.
This requires a device managed by the pv-mqtt-sdk agent and connected over MQTT. Streaming is on demand and doesn’t add these lines to the Hub’s persisted log history; batches are held temporarily for delivery. Sessions end when you leave the tab, expire shortly after it becomes hidden, and have a 30-minute maximum.
See the Live logs guide for setup, limits, and API access.
Try it on your device and let us know which log sources you find most useful!